Advertisement
Sometimes, numbers seem to tell a clear story—until you look closer and see a different one hiding underneath. That’s the strange and often confusing nature of Simpson’s Paradox. It’s when trends in individual groups reverse or vanish once the data is combined. What looked true at first suddenly isn’t.
This paradox shows up in areas like healthcare, hiring, and even artificial intelligence, where patterns can be misleading if not examined carefully. It reminds us that data needs context. Without it, we risk drawing the wrong conclusions and making flawed decisions based on misleading insights that don’t tell the full story.
Simpson’s Paradox is a statistical twist where trends seen in separate groups vanish or reverse when the data is combined. The numbers are correct, but the way data is grouped creates confusion. This paradox reveals how misleading insights can arise when hidden variables aren’t considered in the overall analysis.
Imagine a university with two departments—Engineering and Humanities. In both, women are admitted at a higher rate than men. That sounds fair. But when the overall data is combined, it surprisingly shows men with a higher admission rate. How is that possible? The answer lies in the distribution of applications. If more women apply to the tougher departments with lower acceptance rates, their total success rate will be pulled down. So even though they did better within each group, the combined numbers tell a different—and misleading—story.
The core issue often involves a hidden factor—called a lurking variable—that distorts the big picture. These variables aren’t always obvious, but they can completely change how the data looks. If you rely only on totals or averages without digging into the details, you risk drawing misleading insights that paint a false picture of what’s actually happening.
In artificial intelligence and machine learning, models are built to learn from patterns in data. But when the data includes hidden subgroups or uneven distributions, Simpson’s Paradox can sneak in quietly. If a model is trained on combined data without accounting for group-level differences, it may end up learning patterns that are misleading or flat-out wrong.
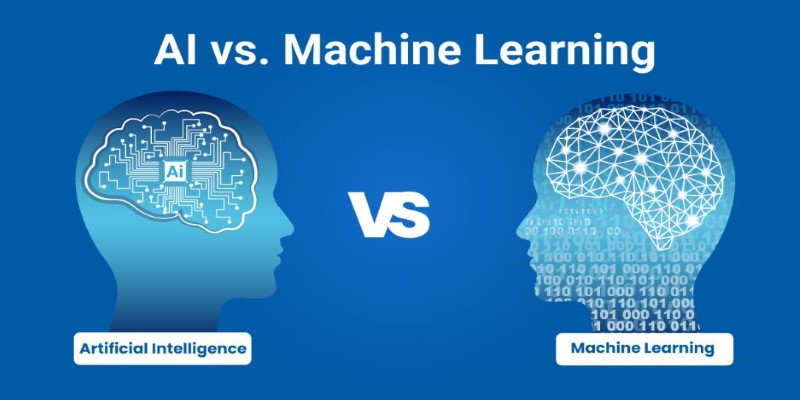
Take a healthcare example: imagine training a medical AI to predict patient recovery rates. You gather data from two hospitals—one with better facilities than the other. In both hospitals, patients who received a certain treatment had better outcomes. However, when the data from both hospitals is combined, it might appear as though the treatment isn't effective at all. This reversed trend misleads the model and can result in misleading insights when making treatment recommendations.
The same problem shows up in fairness. If you're building a hiring algorithm and ignore differences between departments or job levels, the model might favor or reject certain groups unfairly. The algorithm isn’t biased by itself—the bias creeps in through flawed data structure.
This is why machine learning teams must go beyond surface-level patterns. Deep exploratory analysis and proper segmentation help uncover the real story hidden in the data. Without it, AI systems risk making decisions based on false signals.
The dangers of Simpson's Paradox extend well beyond theory. Misreading patterns in data can lead to flawed decisions in health, policy, business, and more. One of the most cited cases comes from a 1970s analysis of gender bias in UC Berkeley admissions. At first glance, data showed women were accepted at lower rates than men.
However, a closer look revealed that women had applied more often to departments with higher rejection rates. Within most individual departments, women actually had slightly higher acceptance rates than men. The combined data told a misleading story.
In healthcare, overlooking subgroup details can be dangerous. A drug might appear effective overall, yet may harm certain age groups or genders. Without breaking down the data by these variables, such misleading insights go unnoticed, and poor medical decisions follow.
The same problem arises in business. Companies may design products or campaigns based on average customer behavior, ignoring how different groups actually respond. One segment may love a product while another rejects it, but combined data masks this.
Simpson’s Paradox teaches a critical lesson: surface-level summaries can hide deeper truths. To avoid false conclusions, it’s vital to dig deeper into data, separate groups clearly, and think critically before making decisions that affect real people.
The best way to avoid falling into the trap of Simpson’s Paradox is to approach data analysis with care and curiosity. It starts with breaking your data into meaningful segments. Whether it's by age, location, gender, department, or period, segmenting helps reveal patterns that might be buried in the overall numbers.
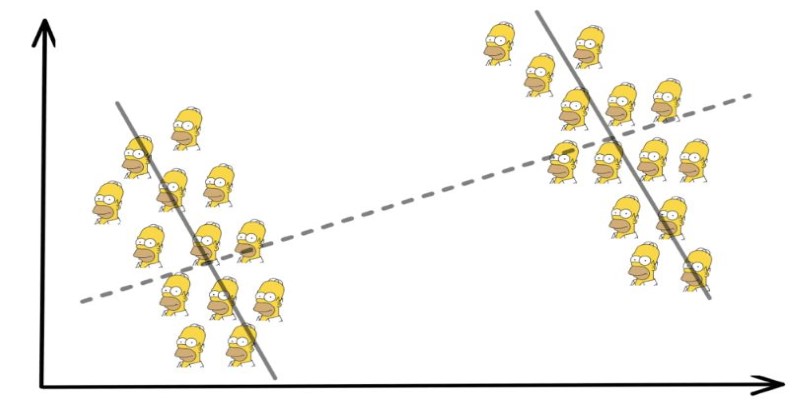
Another important step is to check for hidden variables—factors that might not be obvious at first but have a strong influence on the outcome. These "lurking variables" can quietly shift results and flip conclusions without warning.
Always compare what the data says at the group level versus what it shows overall. If the two stories don't match, that's a signal to look deeper. Visualization also plays a big role. Charts, like grouped bar graphs or scatter plots, can expose inconsistencies that tables might hide.
Finally, don’t underestimate domain knowledge. Understanding the context behind the numbers can help you spot strange results before they lead to misleading insights.
Data analysis isn’t just about numbers—it’s about reasoning. And when the stakes are high, as they often are in AI, medicine, or policy, that kind of thinking becomes essential.
Simpson’s Paradox shows us that data can be tricky. A trend might seem clear in separate groups but completely reverse when those groups are combined. This can lead to misleading insights, especially in AI, healthcare, and business. To avoid being misled, it’s important to examine the data from multiple angles and consider hidden variables. Simple averages don’t always tell the full story. By digging deeper into the data, we can make better, more accurate decisions based on what’s really happening.
Advertisement

Volkswagen introduces its AI-powered self-driving technology, taking full control of development and redefining autonomous vehicle technology for safer, smarter mobility
The FORMAT() function in SQL transforms how your data appears without changing its values. Learn how to use FORMAT() in SQL for clean, readable, and localized outputs in queries
Statistical Process Control (SPC) Charts help businesses monitor, manage, and improve process quality with real-time data insights. Learn their types, benefits, and practical applications across industries
Find out the key differences between SQL and Python to help you choose the best language for your data projects. Learn their strengths, use cases, and how they work together effectively

What Hannover Messe 2025 has in store, from autonomous robots transforming manufacturing to generative AI driving innovation in industrial automation

Accessing Mistral NeMo opens the door to next-generation AI tools, offering advanced features, practical applications, and ethical implications for businesses looking to leverage powerful AI solutions

Can Germany's new AI self-driving test hub reshape the future of autonomous vehicles in Europe? Here's what the project offers and why it matters

How to use MongoDB with Pandas, NumPy, and PyArrow in Python to store, analyze, compute, and exchange data effectively. A practical guide to combining flexible storage with fast processing
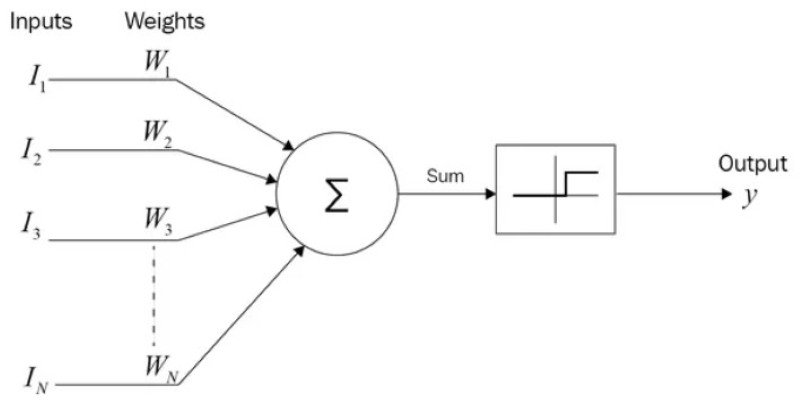
How the SUMPRODUCT function in Excel can simplify your data calculations. This detailed guide explains its uses, structure, and practical benefits for smarter spreadsheet management

Need to update your database structure? Learn how to add a column in SQL using the ALTER TABLE command, with examples, constraints, and best practices explained
Understand the Difference Between Non Relational Database and Relational Database through clear comparisons of structure, performance, and scalability. Find out which is better for your data needs

Discover how DataRobot training empowers citizen data scientists with easy tools to boost data skills and workplace success